Analysing Data To Enact Real World Change
The internet of things isn't really working, context is lost.
Published by Vincent Pickering
on
Updated 2017-03-20 at 16:17:00 : to correct style
The “Internet of things” is starting to become a reality. Interconnected devices like FitBit, Withings Scale, Nike Fuel Band, Google Glass and even your mobile phone can give us real-time access to hard data about ourselves. Never has humanity had such an opportunity to be able to really try to understand our own behaviour and to use that data to help ourselves grow and improve.
Being Realistic
The tools we have to analyse the data often start out with well-meaning developers trying to simplify peoples lives. They do this by breaking down the information and giving users bite-sized chunks of data. It’s unfortunately a slightly naïve way to solve the problem and quickly breaks down over time leading to a dashboard of “stats for the day”:
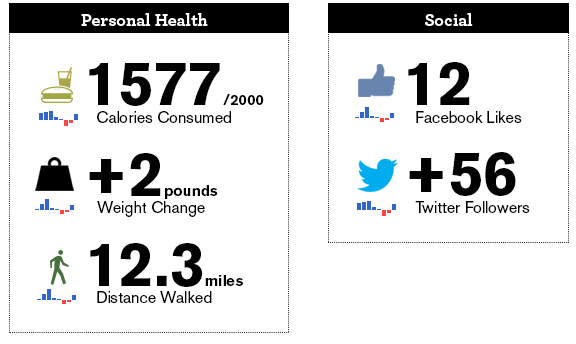
Dashboards are often presented using graphs that aren’t appropriate for the data you are viewing to be useful and only serve as visual eye candy in a desperate attempt to keep interest focused, but even eye candy won’t keep the user happy for ever.
Learning from the past to improve our future
In order to really understand how to make sense of user data in a personable constructive way we need to go back a few years…
In 2005 I worked on the design of a statistical analysis tool for the NHS, (at the time it was the worlds largest database of anonymous patient records) it gave real power to doctors to be able to truly cross analyse information and look for trends, causes of illness and disease.
For example, if a doctor wanted to look for corroborating data and compare on patients with “Condition X” they could group the data and cross reference with many key factors such as: age, location, previous ailments, genetic traits, gender and much more. It was an incredibly powerful statistical tool to help doctors focus on their research and making a breakthrough. The key to the tool’s usefulness was that every answer gave you an action on your query and a new perspective on a current line of thought. The main thing to focus on here is that you nearly always knew what to do next from the outcome.
Context is key
Returning to the original problem, stating single facts lacks any context. Telling a user “Today you tweeted 27 times” is actually meaningless. There is no context for this statement. Is 27 good or bad? If you tweeted 789 times yesterday, does that actually mean 27 today is a good number or is it a bad number? There is literally nothing I can do with this fact that gives me anything constructive to do.
Instead give me a statistic with an action point, create intelligent queries and rules that have context to give meaningful results.
For example, take the hypothetical situation:
If I had a web app that could allow me to make queries in a similar fashion to IFTTT. Then I could create a query to help keep my social network standing intact and ran when the following conditions were met:
If I check-in to more than 3 bars between the hours of 19:00 and 00:00:
- display all Twitter posts during the period.
- display the change in my Twitter stats before 19:00 and after 00:00.
- display all Instagram posts during the period.
- display my weight difference from my weigh in before 19:00 and my weigh in the following morning.
The next morning, using this query the system could automatically run the report and display to me the results so I could see that:
- I tweeted a lot that night, but the quality of the tweets was poor and this caused my followers to drop.
- The frequency of photos posted on Instagram increased dramatically.
- My weight increased from all the alcohol and bad food I ate.
This data now gives me actions on how to better prepare next time I go on a night out.
- I could disable my Twitter access when on a night out to stop me annoying my followers with drunken tweets.
- I could plan my diet by eating fewer calories during the day so the additional alcohol and food doesn’t impact on my weight so greatly.
- I should log in to Instagram the next day and check I didn’t post anything offensive!
When we give our data context it gives us the tools to act upon it and becomes infinitely more powerful. Without context to data, we are often unable to make it relevant to ourselves and our daily lives.