The flexibility of Milky Way Maps
Reflecting on a unique service I designed
Published by Vincent Pickering on
Several years ago I was asked to work on a new government service. This was to be a temporary service stood up for a fixed period and then closed down. It was a unique proposition to consider, often the services I design or contribute towards are intended to run until the need is met, which can be many years.
I thought of this as a live events service, it needed to be stood up quickly and with only a small amount of notice for a fixed period. There were many people involved in the service including multiple external contractors. As the service grew in complexity and answers needed to be more precise, people began using specific jargon from their industry, I observed that they would talk past each other and mis-understand. It became clear to me that we needed a Boundary Object.
When I had been involved in the initial creation of the service I had used a Milky Way Map to align the service to existing processes and describe to senior leaders how it would function. These days (depending upon the intended audience) I may opt to use EDGY, but before EDGY existed I found a way to get everyone on the same page.
Enterprise Design models the bigger picture as three qualities:
- Identity (how a person perceives the service)
- Architecture (the artificial structures in place to support the service)
- Experience (the orchestration of elements that create value for the people consuming the service)
I would model each of these big picture items across the same Milky Way Map on separate pages. This is because I was dealing with different people with differing levels of understanding, need and complexity. We need the right document at the right time to get the clearest outcome.
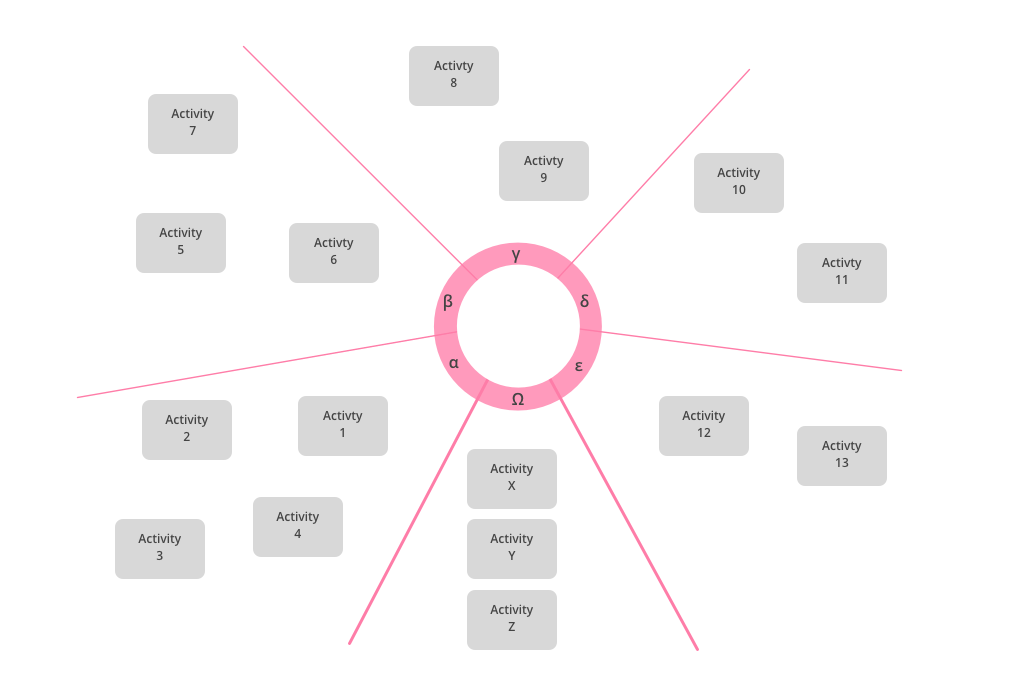
I modelled the Experience as activities. Think simply “What is the activity being performed now to deliver the outcome?”. This gave a great place for everyone to understand what was happening.
Next I colour coded the activity to the entity that owned the activity.
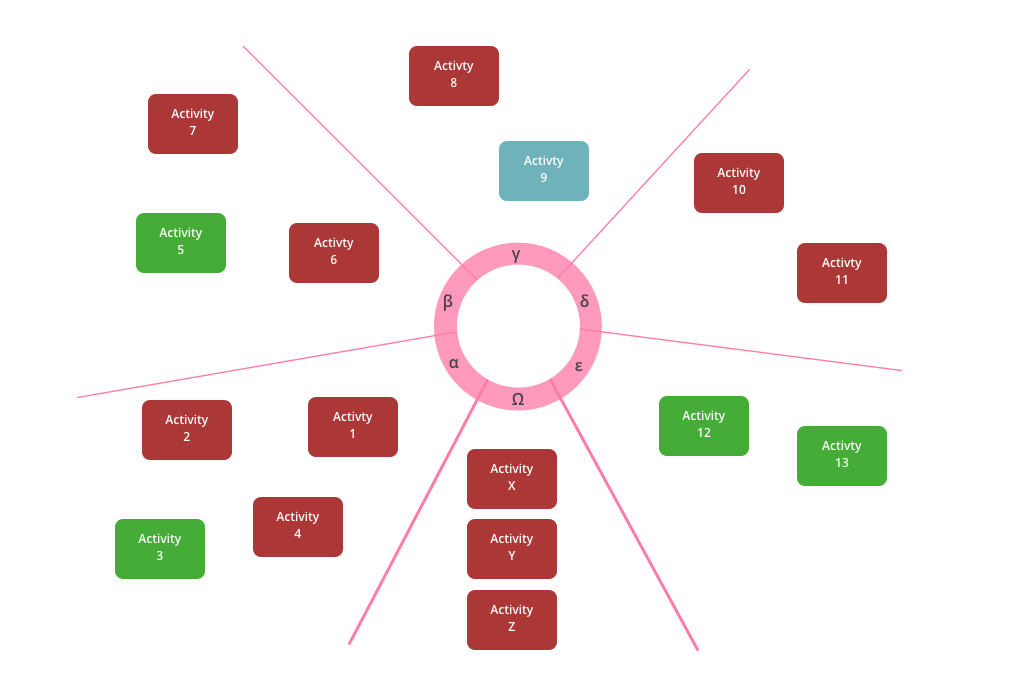
This worked well, each of the various stakeholders understood what they needed to do at a glance, what other were doing and the basic sequence that they occurred in.
A little while later a senior leader asked me “how can we be sure on the day that everything will go as planned?” I thought about this a while and concluded the answer lay in how communication of information happens. It’s one thing to understand what activity you do but you need to agree the information exchange process. Be that, through machines or manually by people handing over paper documents, or some other method. I worked with the respective teams using the activities map and we added manual and automatic information flows.
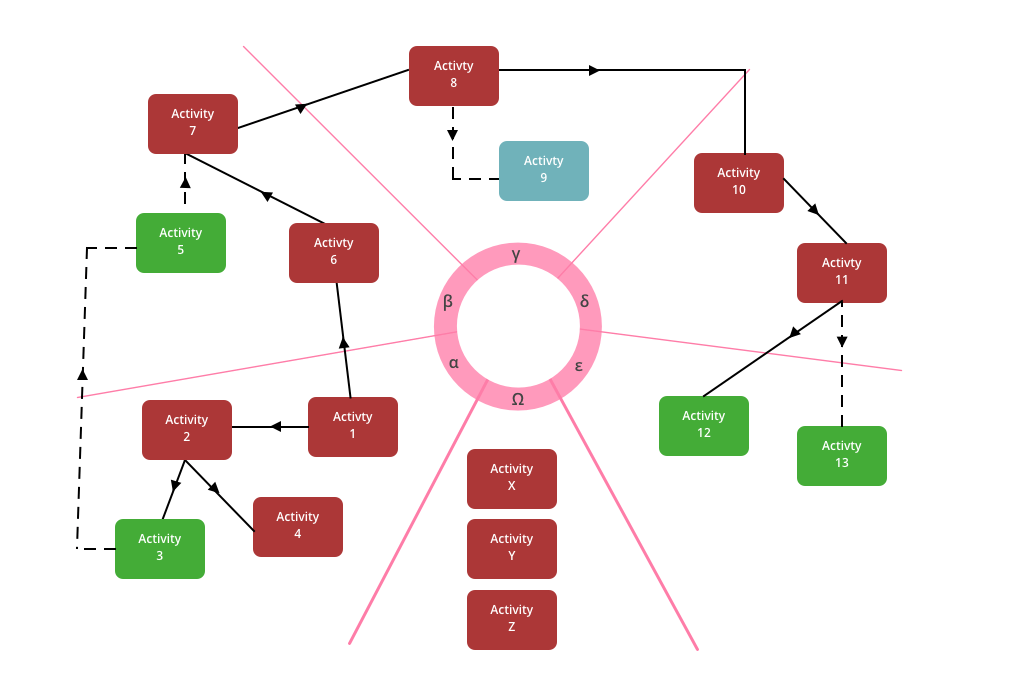
This was really helpful, now we knew who was doing what. We knew how they would receive information and how they would hand-off to the next person in the chain. Where automated process would occur, we could write automated tests to ensure code was working correctly. Where manual processes would occur, we could agree procedure and create checks and balances to make sure if something appears to go wrong it is quickly picked up and dealt with. Pretty great for one document.
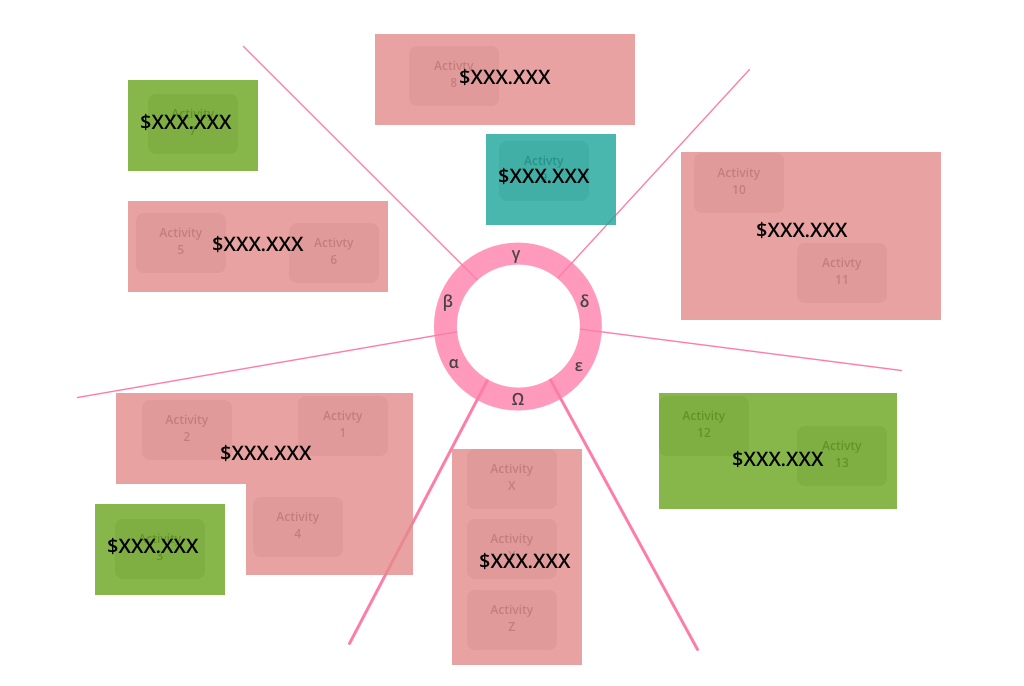
The event went without a hitch and everything worked as intended. Later I was approached by a senior leader who was curious what the service cost. I worked with the managers and accountants to understand the cost, but I realised the milky way map would again be useful. We worked out the cost of each activity on the diagram (including hourly rates for staff) and could attribute a cost to each activity performed and the architecture used (mapping from the other diagram) This proved hugely powerful and useful to the executive as they could easily compare costs across the whole service and demonstrate which activities were costly and understand why.
I keep finding new ways to express the different information through this means that can help to give a consistent picture of what is happening over a complex service. If you’re not using Milky Way Maps I would encourage you to give them ago.